
The analysis is ordinary. That is the point of the preceding five steps: a dataset extracted by a model, once validated, is analysed like any other, with the same descriptive tables, cross-tabulations and models, and the same obligation to say what the data cannot support. What is new is one extra paragraph in the methods section, reporting the codebook version and the reliability figures.
Section 1The analysis dataset
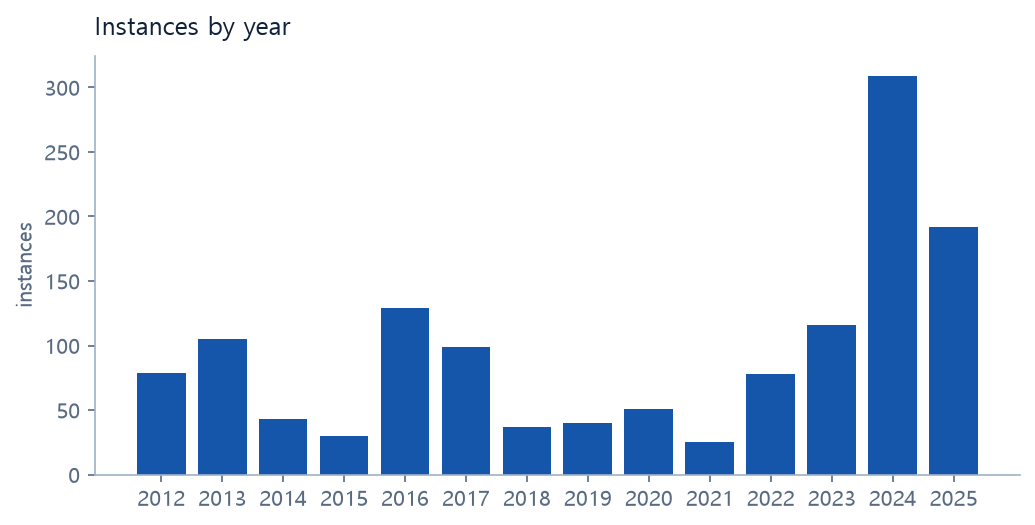
The analysis uses the full sample: Coder 1's 1,702 rows from all 946 articles in the corpus, not a pilot draw. It keeps relevant rows with coder confidence 2 or 3, which leaves 1,333 instances from 2012 to 2025. Years are grouped into three periods that the exploration in Step 2 suggested and that the article counts in Step 1 support: 2012–2017 (485 instances), 2018–2021 (153), and 2022–2025 (695). The middle period is the thinnest; results involving it are less precise.
The confidence filter is a choice to defend, not a default. It removes 243 low-confidence rows, mostly cases where both province and the event boundary were uncertain. An alternative is to keep every row and report results with and without the filter. For a real project, the filter should follow the validation results: keep the confidence levels at which the AI coding validated, send the others to human review.
Section 2Univariate
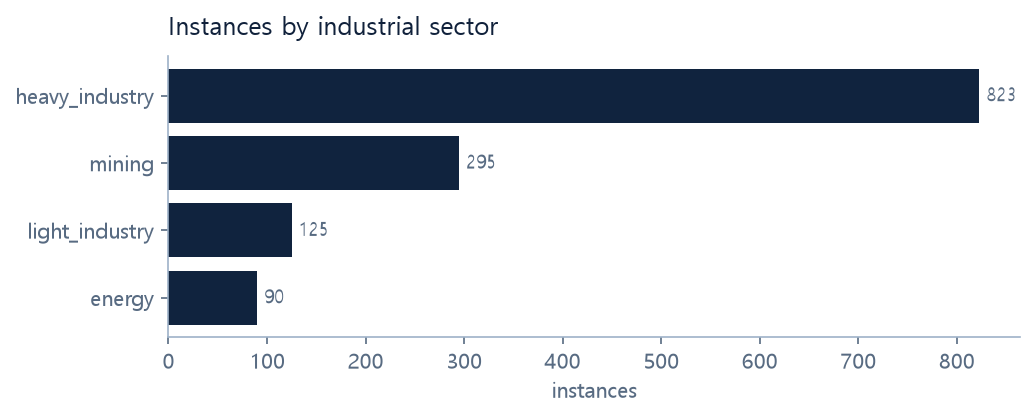
Where does state media attention to enterprises go? Heavy industry dominates: steel, machine-building, chemicals and cement together account for 62 percent of instances, and mining for a further 22 percent. Light industry is one row in ten and energy one in fifteen, despite the regional-development and power campaigns of recent years. Remember that these are the four sectors the researcher chose in Step 3; farms and fisheries were removed from the study, not found to be absent.
| sector | n | % |
|---|---|---|
| heavy_industry | 823 | 61.7 |
| mining | 295 | 22.1 |
| light_industry | 125 | 9.4 |
| energy | 90 | 6.8 |
| event_type | n | % |
|---|---|---|
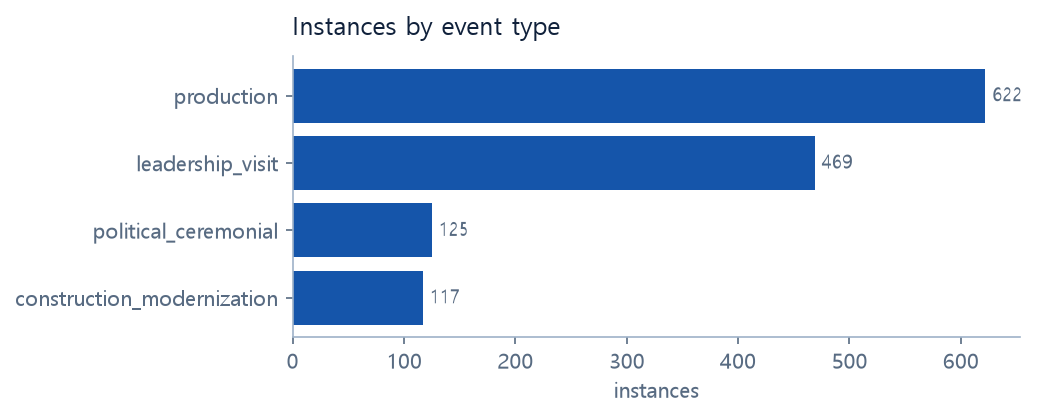
| production | 622 | 46.7 |
| leadership_visit | 469 | 35.2 |
| political_ceremonial | 125 | 9.4 |
| construction_modernization | 117 | 8.8 |
| leader_visit | n | % |
|---|---|---|
| none | 822 | 61.7 |
| premier_cabinet | 490 | 36.8 |
| kim_jong_un | 21 | 1.6 |
| province | n | % |
|---|---|---|
| unknown | 537 | 40.3 |
| pyongan_s | 251 | 18.8 |
| hamgyong_s | 189 | 14.2 |
| hamgyong_n | 173 | 13.0 |
| pyongyang | 98 | 7.4 |
| hwanghae_n | 26 | 2.0 |
| kangwon | 18 | 1.4 |
| nampo_rason | 16 | 1.2 |
| chagang | 9 | 0.7 |
| pyongan_n | 8 | 0.6 |
| hwanghae_s | 5 | 0.4 |
| ryanggang | 3 | 0.2 |
| enterprise | rows |
|---|---|
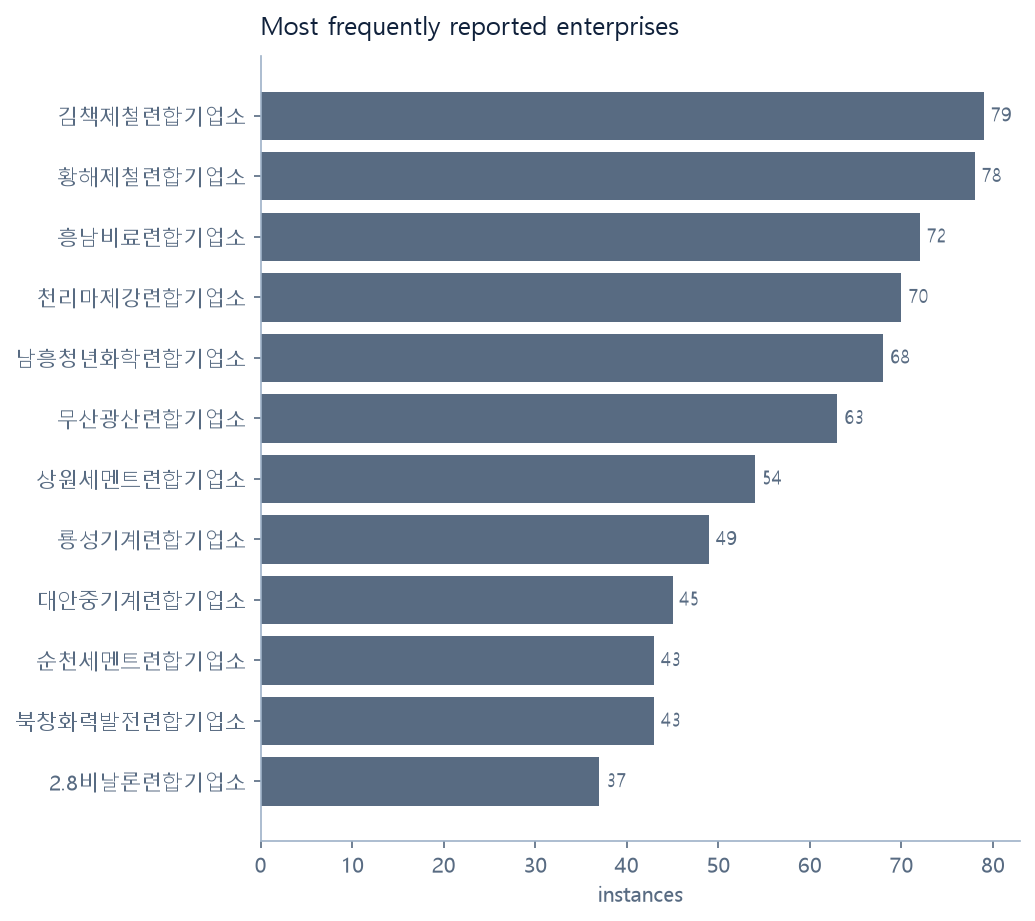
| 김책제철련합기업소 | 79 |
| 황해제철련합기업소 | 78 |
| 흥남비료련합기업소 | 72 |
| 천리마제강련합기업소 | 70 |
| 남흥청년화학련합기업소 | 68 |
| 무산광산련합기업소 | 63 |
| 상원세멘트련합기업소 | 54 |
| 룡성기계련합기업소 | 49 |
| 대안중기계련합기업소 | 45 |
| 북창화력발전련합기업소 | 43 |
| 순천세멘트련합기업소 | 43 |
| 2.8비날론련합기업소 | 37 |
Section 3Bivariate
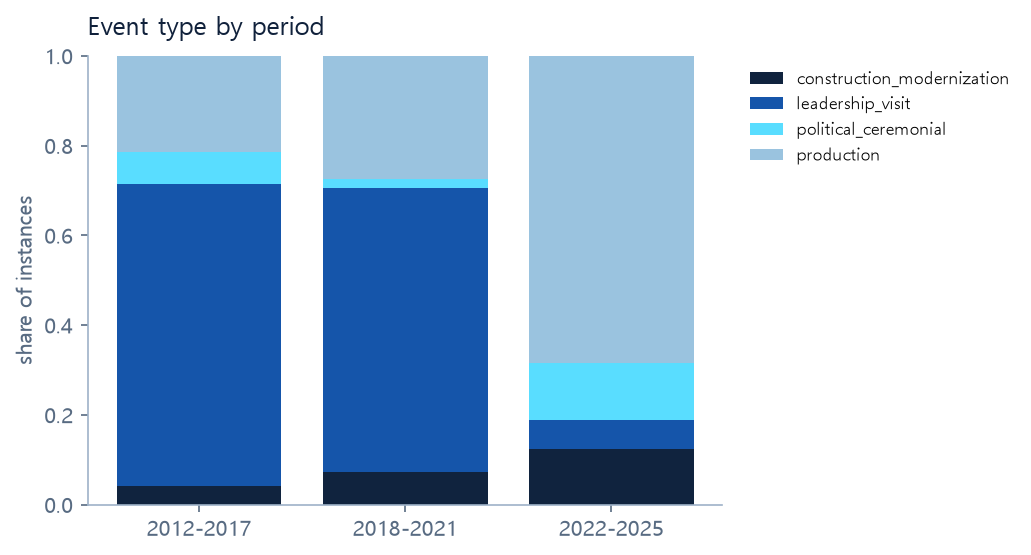
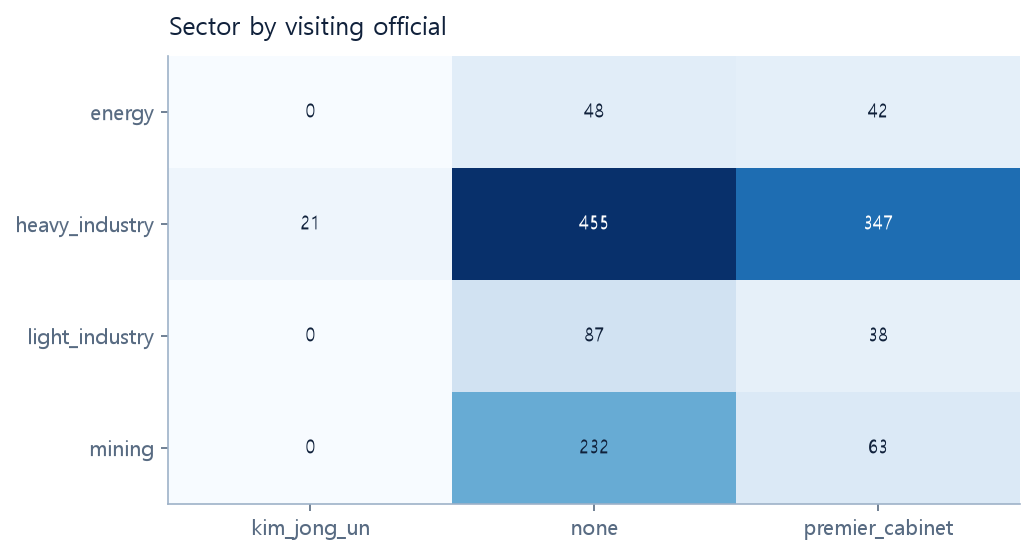
Has what is reported about enterprises changed? Cross-tabulating event type by period shows the shift: in 2012–2017 two instances in three were leadership visits; in 2022–2025 more than two in three are production results, and visits are one in sixteen. Cross-tabulating sector by visiting official shows that visits, when they happen, concentrate in heavy industry and energy; mining enterprises are mostly reported without a visitor.
| period \ event | construction_modernization | leadership_visit | political_ceremonial | production | total |
|---|---|---|---|---|---|
| 2012-2017 | 20 | 327 | 34 | 104 | 485 |
| 2018-2021 | 11 | 97 | 3 | 42 | 153 |
| 2022-2025 | 86 | 45 | 88 | 476 | 695 |
| period \ leader_visit (%) | kim_jong_un | none | premier_cabinet |
|---|---|---|---|
| 2012-2017 | 3.1 | 30.5 | 66.4 |
| 2018-2021 | 1.3 | 30.1 | 68.6 |
| 2022-2025 | 0.6 | 90.4 | 9.1 |
| sector \ event | construction_modernization | leadership_visit | political_ceremonial | production | total |
|---|---|---|---|---|---|
| energy | 3 | 42 | 5 | 40 | 90 |
| heavy_industry | 88 | 336 | 74 | 325 | 823 |
| light_industry | 0 | 38 | 28 | 59 | 125 |
| mining | 26 | 53 | 18 | 198 | 295 |
| sector \ leader_visit | kim_jong_un | none | premier_cabinet | total |
|---|---|---|---|---|
| energy | 0 | 48 | 42 | 90 |
| heavy_industry | 21 | 455 | 347 | 823 |
| light_industry | 0 | 87 | 38 | 125 |
| mining | 0 | 232 | 63 | 295 |
The fall in reported visits after 2022 could mean that officials visit enterprises less, that the newspapers report visits less, or that the keyword corpus catches fewer visit articles because visit headlines now name the leader rather than the enterprise. A corpus built by keyword search can only speak to how enterprises are written about when they are the headline subject. Say so.
Section 4Multivariate
Does the period effect survive controlling for sector, given that the sectoral mix of reported enterprises has also shifted? A logistic regression of any official visit (leader_visit ≠ none) on sector and period, with heavy industry and 2012–2017 as reference categories, says it does.
| term | coef | odds ratio | s.e. | p |
|---|---|---|---|---|
| Intercept | 1.284 | 3.612 | 0.127 | 0.0 |
| C(sector)[T.energy] | -0.438 | 0.645 | 0.281 | 0.119 |
| C(sector)[T.mining] | -1.237 | 0.29 | 0.196 | 0.0 |
| C(sector)[T.light_industry] | -1.259 | 0.284 | 0.249 | 0.0 |
| C(period)[T.2018-2021] | -0.058 | 0.943 | 0.211 | 0.782 |
| C(period)[T.2022-2025] | -3.196 | 0.041 | 0.171 | 0.0 |
Holding sector constant, an instance in 2022–2025 has about one twenty-fifth the odds of involving a reported visit as an instance in 2012–2017 (OR 0.04, p < .001); 2018–2021 does not differ from 2012–2017 (OR 0.94, p = .78). Light-industry enterprises (OR 0.28, p < .001) and mines (OR 0.29, p < .001) are less likely to be visited than heavy-industry plants; energy is not distinguishable from heavy industry (OR 0.65, p = .12). The result is descriptive of reporting, not of policy, for the reason given above. It rests on 1,333 rows from the full corpus that three AI coders agree on but that a full human sample has not yet validated. It is a finding to validate, not yet one for a journal.
Section 5Reporting
A methods paragraph for a dataset built this way needs to state, in order: the source corpus and the keyword restriction with its counts (Step 1); the unit of analysis and the variables (Step 3); the codebook version used and where it is archived; the model and date of extraction and the number of articles coded (Step 4); the number of independent AI coders and their agreement, then the human sample size and the human–AI reliability statistics by variable, with the human–human figures as the comparison (Step 5); and any filter applied to the dataset before analysis (this page, Section 1). All of it exists already in the project folder; the run log, codebook README and validation report were written for exactly this paragraph.
- analysis_tables.xlsxEvery table on this page as a sheet.
- analyze.pyProduces the tables and figures from dataset_ai_coded.xlsx. Arguments: --data, --min-confidence.
From here the work is validation and extension. A human sample of 10 to 20 percent of this dataset, coded as in Step 5, turns the AI–AI consistency reported there into a validated dataset; the same codebook and prompts can then be run over a larger corpus, such as further newspapers or years. Freeze the codebook version, the prompts, the model name and the seeds before you do, and the result will be reproducible by the next person, human or otherwise.
Terminology
- Analysis dataset
- The subset of extracted rows that passes the filters stated in the methods (here: relevant, confidence ≥ 2).
- Univariate / bivariate / multivariate
- Descriptions of one variable's distribution; of the relation between two; and of one outcome's relation to several predictors at once.
- Odds ratio
- In a logistic regression, the multiplicative change in the odds of the outcome for a one-unit change in a predictor, relative to the reference category.
- Run manifest
- The record of corpus version, codebook version, prompts, model, seeds and dates that makes an extraction reproducible.